Businesses today have access to more data than ever before, but without the right KPIs, it’s just noise. Key Performance Indicators (KPIs) are the metrics that show how effectively you and your team are achieving business objectives. The term itself doesn’t matter as much as the purpose: KPIs are the measurable numbers that help you assess performance over time.
KPIs can be set at the company, team, or individual level, and they vary depending on the department or role. Some common examples include:
- Number of leads generated
- Revenue targets
- Retention or churn rates
- Return on ad spend (ROAS)
- Time-to-close (sales cycle duration)
- Customer Satisfaction Score (CSAT)
- …and many more, depending on your role and business goals.
This guide breaks down what KPIs are, how to choose them, and how to use them to build smarter, more profitable strategies for your business.
Why KPIs Matter to Your Marketing and Business Strategy
KPIs turn business goals into measurable outcomes. Without them, you’re operating on instinct instead of insight. They help teams stay focused, align efforts across departments, and track progress toward what actually moves the business forward. The KPIs that matter can help you understand how to generate more leads, improve retention, or increase your ad reach. Attention and budgets are limited, so choosing the right KPIs gives you the clarity to prioritize what works and data to make confident decisions to cut what doesn’t.
Surface Metrics vs. Compound Metrics
When you’re evaluating performance, some metrics give you a quick snapshot, while others offer layered insights that tell a fuller story. Surface metrics are raw numbers from your data, and compound metrics involve calculations for context.
Surface-Level or Simple Metrics
Surface metrics include data like total sessions, pageviews, or number of followers. They are raw counts. Surface metrics are useful indicators of activity, but they don’t say much about performance. For example, 10,000 visitors to your website sounds impressive, but what did they actually do?
Compound Metrics
Compound metrics, on the other hand, calculate relationships between surface metrics to reveal deeper insights. These are the KPIs that generally matter most to businesses because they show efficiency, effectiveness, and impact. Think of them as ratios or percentages that answer questions like:
- What percentage of traffic converts? (conversion rate)
- How much revenue are we earning for every dollar spent? (ROAS)
- How much value does a customer bring over time? (LTV)
- What percentage of our clients are leaving? (churn rate)
Compound metrics are necessary for evaluating what is working. They account for context and reveal patterns you can act on.
KPI Examples & Choosing KPIs for Your Business
Choosing the right KPIs starts with understanding what you’re trying to achieve. Here’s a quick breakdown of common marketing goals, the KPIs that support them, and whether those KPIs are surface-level indicators or compound metrics that provide deeper insight.
| Business Goal | Key Performance Indicator (KPI) | Metric Type |
|---|---|---|
| Grow website traffic | Sessions | Surface |
| Improve engagement | Bounce Rate | Compound |
| Generate leads | Conversion Rate | Compound |
| Increase paid efficiency | Return on Ad Spend (ROAS) | Compound |
| Shorten sales cycle | Time-to-Close | Surface |
| Improve customer retention | Churn Rate | Compound |
| Maximize customer value | Customer Lifetime Value (LTV) | Compound |
| Acquire customers affordably | Customer Acquisition Cost (CAC) | Compound |
| Boost email performance | Click-Through Rate (CTR) | Compound |
| Expand brand reach | Social Followers | Surface |
Some KPIs like conversion rate, ROAS, LTV, and CAC don’t just track activity, they tell you how efficiently your marketing efforts are turning attention into revenue.
Let’s break down each of these key KPIs to understand how they work and how to get the most value from them.
Conversation Rate
One of the most popular KPIs for a business to track is conversion rate. Conversion rate is the percentage of people who take a defined desired action. This action can be making a purchase, booking a call, or signing up for a program.
Typically, conversions are divided by total sessions or visitors to give us a percentage. This simplification is helpful because our brains aren’t naturally great at comparing large numbers. Percentages are easier to digest and analyze.

For example, if your site has 10,000 visitors and 500 of them convert, your conversion rate is 5%.
But even this metric can be nuanced. Should your denominator include all sessions, or just engaged ones?
By excluding unengaged visitors (visitors who landed on your page and immediately left your site without taking any action), you get a clearer picture of how your content or offers resonate with users who are at least somewhat interested.
Return on Ad Spend (ROAS)
ROAS is a go-to metric for evaluating paid media performance. It’s calculated by dividing revenue generated from ads by the cost of those ads. If you spend $1,000 and generate $4,000 in revenue, your ROAS is 4.0.

It’s a simple ratio, but it carries weight because it tells you whether your campaigns are profitable. A ROAS below 1.0 means you’re losing money on ads. A ROAS of 3.0 or higher may be sustainable, depending on your margins.
Just like conversion rate, context matters. ROAS can vary widely depending on the channel, campaign type, and customer journey length. Brand awareness ads may have a lower immediate ROAS but contribute to future conversions. Retargeting campaigns typically show higher ROAS, but they’re reaching users already familiar with your brand.
Use ROAS in combination with other KPIs, like CAC and LTV, to get a full view of your marketing efficiency.
Customer Lifetime Value (LTV)
Customer Lifetime Value (LTV) estimates how much revenue a customer brings in over the entire course of their relationship with your business. It’s one of the most strategic metrics you can track because it helps you understand how much you should spend to acquire and retain a customer.
There are a few ways to calculate LTV, but a common method is:
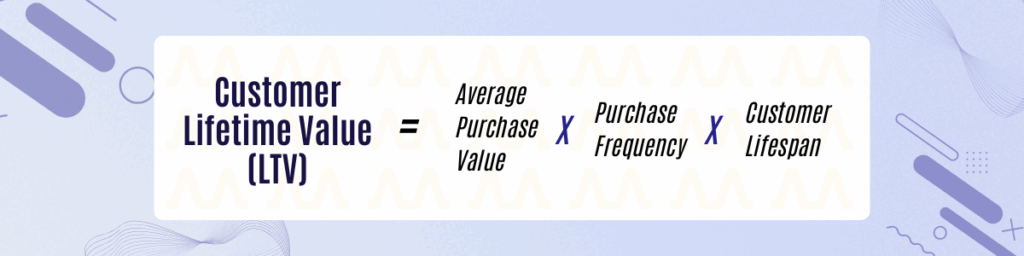
So if a customer typically spends $50 per order, buys twice a year, and stays with your brand for 3 years, their LTV is $300.
LTV is essential for evaluating long-term growth potential, pricing strategy, and acquisition cost thresholds. If your average LTV is $500 and you’re spending $450 to acquire a customer, that may still work if you’re profitable and retention is strong. But if your LTV is lower than your CAC, you have a problem.
That’s where the next metric comes in.
Customer Acquisition Cost (CAC)
CAC is the cost of turning a prospect into a paying customer. It includes ad spend, marketing expenses, sales team salaries, and other costs tied directly to customer acquisition. The basic formula is:

If you spent $10,000 and gained 200 new customers, your CAC is $50.
On its own, CAC is a useful gauge of how efficiently your business can grow. But its true value comes when paired with LTV. The LTV:CAC ratio helps you determine if you’re spending wisely or overspending to chase short-term wins.
In general, a healthy LTV:CAC ratio is 3:1 or higher. Anything less might mean your growth isn’t sustainable. Anything higher could indicate you have room to scale faster.
Think in Terms of Funnel Segments For Conversion Rate Optimization (CRO)
Visitors to your website are not all equal, they’re in different stages of their journey with your brand. Some landed on the wrong page and quickly left. Others are discovering your product for the first time. A few are repeat visitors, already warmed up and ready to take action.
Segmenting your traffic helps you understand these groups more effectively. It’s not just about having the right KPIs, it’s about analyzing the path to conversion. Once you better understand the path to conversion, you can tailor your content and user experience accordingly.
Ask yourself: Are we targeting the right users at the right stage with the right messaging?
Compare Time Periods for Context
The context of all these metrics should be in comparison to a prior period – either the same period just before – e.g. month over month – or ideally, year over year to adjust for seasonal differences. If you work in ecommerce, it would be a huge mistake to compare summer sales to black friday, depending on what you’re selling of course.

Test Everything: A/B Testing and KPIs
Period-over-period comparisons are great, but in marketing, data wins. This is where A/B testing comes in. You should Always Be Testing.
Say you have a hypothesis: “If we change our CTA button text, conversions will improve.” A/B testing allows you to validate that hypothesis by splitting traffic into control and test groups. By comparing the conversion rates between the two, you can determine whether the change had a statistically significant effect.
This is where KPIs become powerful. They give you the framework to prove what’s working and what needs to change.
At the end of the day, we’re not just tracking numbers, we’re building a predictable model for growth.
What If You Don’t Have Enough Data to Measure?
When we meet a new client at Analytics Answers, a common pain point we’re presented with is:
“We don’t have enough conversions to run a valid test.”
This is especially true for newer websites, high-ticket services, or niche markets where traffic is lower and buying cycles are longer. But low volume doesn’t mean you’re flying blind, it just means you need to shift your focus.
Start by narrowing your lens and adjust your denominator. Instead of looking at total sessions or sitewide conversion rate, zoom in on more specific moments in the funnel. Look at form page visits, scroll depth on your landing pages, or engagements with a CTA. This lets you see where users are dropping off in your funnel and gives you a more actionable view of your site’s performance.
Let’s say you only get 7 leads a month, but you see 5,000 visits to your form page. That’s still valuable data. You can now test:
- Is the form too long?
- Are your prices too high?
- Is the messaging confusing or mismatched with user intent?
These questions generate new hypotheses, and each one can be tested to improve your KPIs over time.
From Insight to Taking Action – Our Final Thoughts
There’s no one-size-fits-all KPI. What matters is choosing metrics that reflect your business goals, audience behavior, and sales funnel. From there, segment your data, build hypotheses, and test improvements relentlessly.
Before your next team meeting, ask:
- Are we measuring the KPIs that align with our business goals?
- Are we segmenting our data for meaningful insights?
- Are we testing hypotheses, or just watching metrics move?
- Do we have the right tools to track, visualize, and act?
Not sure if you have the answers to those questions? Let us take a look. At Analytics Answers, we specialize in analytics solutions. We identify the right metrics to measure for your business goals and develop ways to boost your key performance indicators.